

Watchdog Timers in Embedded Systems
June 17, 2026
3 min
The device sits in a cabinet on a factory floor three time zones away. It reset at 3:47 AM. No one saw it happen. The only clue: a log entry saying “System restarted” — no reason, no context, no stack trace.
This scenario plays out daily across the embedded industry. Teams ship firmware with printf over UART and a watchdog, call it “debuggable,” then discover too late that field failures leave no usable evidence. The watchdog fired — but which task starved? The device browned out — but was it a power supply issue or a current spike from the radio? A HardFault occurred — but the handler just triggered a reset, erasing the only moment that mattered.
Production debugging is not about attaching a debugger. It’s about designing firmware that explains itself after the fact.
Most embedded firmware operates at one of two extremes:
| Approach | Field Utility |
|---|---|
printf over UART at 115200 baud | Useless — no persistence, no structure, bandwidth-starved, loses context on reset |
| Commercial trace tools (Tracealyzer, SystemView) | Powerful in lab — but requires debug probe, high bandwidth, and licensed tooling; impractical for deployed fleets |
The gap between them is where field failures live. RTEdbg, Memfault, and custom black-box implementations fill this gap by moving formatting off the target, persisting across resets, and working over any transport.
An aircraft black box doesn’t record everything — it records the right things. Your firmware black box needs:
+------------------------------------------------------------------+| MINIMUM BLACK BOX CONTENTS |+------------------------------------------------------------------+| Reset reason (RCC_CSR / RSTC_SR / ESP-IDF reset_reason_t) || Uptime before reset (monotonic tick count) || Firmware version + build ID (git SHA, build timestamp) || Hardware variant / board revision || Application state machine state (enumerated, not string) || Recent event ring buffer (last 20-50 events, 4-8 bytes each) || Minimum heap watermark (bytes) || Task stack high-water marks (per critical task) || Fault registers / core dump (if architecture permits) |+------------------------------------------------------------------+
Each entry must be machine-parseable — an event code, not a string. Decode on the host.
Every MCU exposes reset cause registers. On STM32, read RCC->CSR early in main() before clearing flags:
typedef enum {RESET_POR = 0x01, // Power-on / brown-outRESET_PIN = 0x02, // NRST pinRESET_WDG = 0x04, // Independent watchdog (IWDG)RESET_SW = 0x08, // Software reset (NVIC_SystemReset)RESET_LOCKUP = 0x10, // Core lockupRESET_WWDG = 0x20, // Window watchdogRESET_LPWR = 0x40, // Low-power mode exit} reset_reason_t;static reset_reason_t capture_reset_reason(void) {uint32_t csr = RCC->CSR;RCC->CSR |= RCC_CSR_RMVF; // Clear flags after readingif (csr & RCC_CSR_IWDGRSTF) return RESET_WDG;if (csr & RCC_CSR_WWDGRSTF) return RESET_WWDG;if (csr & RCC_CSR_SFTRSTF) return RESET_SW;if (csr & RCC_CSR_PORRSTF) return RESET_POR;if (csr & RCC_CSR_PINRSTF) return RESET_PIN;if (csr & RCC_CSR_LPWRRSTF) return RESET_LPWR;return RESET_POR;}
On ESP32, esp_reset_reason() gives the same. On Zephyr, hwinfo_get_reset_cause() (from <zephyr/drivers/hwinfo.h>). Capture this before any peripheral initialization — some bootloaders clear reset flags.
The Cortex-M HardFault handler is your last chance to capture forensic data. The default weak handler usually loops forever or resets — both destroy evidence.
// Minimal register capture for Cortex-M3/M4/M7__attribute__((naked)) void HardFault_Handler(void) {__asm volatile("TST LR, #4 \n" // Check EXC_RETURN bit 2"ITE EQ \n""MRSEQ R0, MSP \n" // Main stack pointer"MRSNE R0, PSP \n" // Process stack pointer"B save_fault_context \n");}// Called with R0 = faulting stack pointervoid save_fault_context(uint32_t *sp) {fault_snapshot_t *fs = (fault_snapshot_t *)BLACKBOX_ADDR;fs->r0 = sp[0];fs->r1 = sp[1];fs->r2 = sp[2];fs->r3 = sp[3];fs->r12 = sp[4];fs->lr = sp[5];fs->pc = sp[6];fs->xpsr = sp[7];// Fault status registers (Cortex-M3/M4/M7 — ARMv7-M)fs->cfsr = SCB->CFSR; // Configurable Fault Status Registerfs->hfsr = SCB->HFSR; // HardFault Status Registerfs->mmfar = SCB->MMFAR; // MemManage Fault Address Registerfs->bfar = SCB->BFAR; // Bus Fault Address Register// Force persistent write (flash or retained RAM)blackbox_write((uint8_t *)fs, sizeof(fault_snapshot_t));// Only NOW reset — or enter infinite loop for probe attachmentNVIC_SystemReset();}
Key registers to decode:
CFSR is a composite of three sub-registers — MMFSR (MemManage): IACCVIOL (instruction access violation), DACCVIOL (data access violation), MUNSTKERR (unstacking error); BFSR (BusFault): STKERR (stacking error), UNSTKERR (unstacking error), PRECISERR / IMPRECISERR (data bus errors); UFSR (UsageFault): INVSTATE (invalid EPSR), UNDEFINSTR (undefined instruction)PC gives the faulting instruction address — map to source with addr2line -e firmware.elf 0x0800xxxxLR with EXC_RETURN tells you which stack was active and whether returning to Thread/Handler modeprintf burns 40-60 bytes per log entry. A packed binary entry encoding the same data: 17 bytes.
// Target-side: lightweight macro, zero formattingtypedef struct __attribute__((packed)) {uint32_t timestamp; // Monotonic ticksuint16_t module_id; // SUBSYS_ADC, SUBSYS_COMM, SUBSYS_RTOS, etc.uint8_t severity; // 0=ERROR, 1=WARN, 2=INFO, 3=DEBUGuint16_t event_code; // Machine-parseable, defined in shared headeruint32_t payload[2]; // Context: register value, state, counter, etc.} log_entry_t;// Circular buffer in retained RAM (survives soft reset)#define LOG_BUF_ENTRIES 1024static log_entry_t log_buf[LOG_BUF_ENTRIES];static volatile uint32_t log_head = 0;static uint32_t log_wrap_count = 0;void log_event(uint16_t module, uint8_t severity, uint16_t code,uint32_t p1, uint32_t p2) {log_entry_t *e = &log_buf[log_head];e->timestamp = get_tick_count();e->module_id = module;e->severity = severity;e->event_code = code;e->payload[0] = p1;e->payload[1] = p2;log_head = (log_head + 1) % LOG_BUF_ENTRIES;if (log_head == 0) log_wrap_count++;}// Host-side decoding (Python example)EVENT_CODES = {0x1001: "ADC_OVERRUN",0x1002: "ADC_CONVERSION_COMPLETE",0x2001: "MQTT_CONNECT",0x2002: "MQTT_DISCONNECT",0x2003: "MQTT_PUBLISH_TIMEOUT",0x3001: "TASK_STACK_WATERMARK",0x3002: "QUEUE_FULL",0x3003: "MUTEX_TIMEOUT",}def decode_log_entry(raw_bytes):ts, mod, sev, code, p1, p2 = struct.unpack("<IHBHII", raw_bytes)return {"timestamp": ts,"module": MODULE_NAMES.get(mod, f"MOD_{mod:04x}"),"severity": ["ERROR","WARN","INFO","DEBUG"][sev],"event": EVENT_CODES.get(code, f"EVT_{code:04x}"),"payload": [p1, p2]}
Benefits:
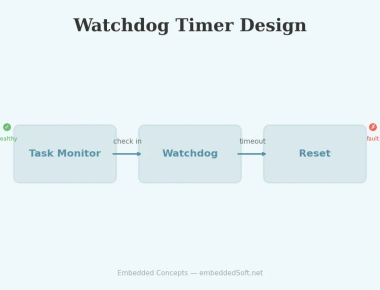
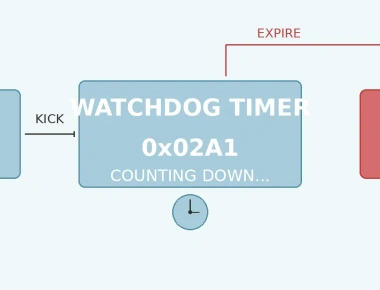
payload[0] = 0x0800c420 as main+0x134 in task_comm.cThe watchdog is not a debugging strategy. It’s a recovery mechanism. Without diagnostics around it, you only know “it reset.”
// Window Watchdog Early Wakeup Interrupt (EWI)// Fires N ms before actual reset — use to snapshot statevoid WWDG_IRQHandler(void) {blackbox_snapshot(BB_SNAPSHOT_WDOG_WARNING);// Feed watchdog ONE LAST TIME to buy coredump write timeWWDG->CR = WWDG_CR_WDGA | 0x7F; // Example STM32 WWDG feed// Clear Early Wakeup Interrupt flagWWDG->SR = 0;}// In main(), after reset reason capture:if (reset_reason == RESET_WWDG) {// Check if we have a warning snapshotif (blackbox_has_snapshot(BB_SNAPSHOT_WDOG_WARNING)) {// We know the watchdog fired AND we captured pre-reset statereport_watchdog_with_context();} else {// Watchdog fired without warning snapshot —// either no warning interrupt, or interrupt was maskedreport_watchdog_blind();}}
Critical: Assign the WWDG Early Wakeup Interrupt a high priority (low numerical value on Cortex-M) so it is not masked by lower-priority handlers when the system is under load. The EWI fires before the hardware reset — if the interrupt is pending but preempted, you lose the snapshot.
| Transport | Use Case | Bandwidth | Latency |
|---|---|---|---|
| UART + cellular gateway | Field devices with modem | Medium | Seconds |
| BLE log exfiltration | Nearby, inaccessible devices | Low | Minutes |
| MQTT/CoAP uplink | Cloud-connected products | High | Seconds |
| Retained RAM + service visit | Offline devices, physical access | N/A | Days/weeks |
| USB MSD / DFU | Lab/factory, direct connection | Very High | Instant |
Rule: The log buffer must survive the transport layer. A ring buffer in retained RAM (backup domain, VDD_VBAT) survives soft resets. Periodic flush to external flash/FRAM survives hard power loss.
When a field device misbehaves and logs aren’t enough, push a debug build variant via OTA:
// Build-time feature flags (NOT #ifdef DEBUG)#define FEATURE_VERBOSE_LOGGING (1 << 0)#define FEATURE_RUNTIME_ASSERTS (1 << 1)#define FEATURE_TRACE_HOOKS (1 << 2)#define FEATURE_STACK_CANARIES (1 << 3)static uint32_t debug_features = 0;// Runtime command: "debug_enable 0x0F"void cmd_debug_enable(uint32_t mask) {debug_features = mask;log_event(MOD_SYSTEM, SEV_INFO, EVT_DEBUG_FEATURES_CHANGED, mask, 0);}// In logging macro:#define LOG_EVENT(mod, sev, code, p1, p2) \do { if (debug_features & FEATURE_VERBOSE_LOGGING || sev <= LOG_LEVEL) \log_event(mod, sev, code, p1, p2); } while(0)
Pull the debug build back once you’ve captured the data. Never leave verbose builds in production — they expand attack surface and consume resources.
A gateway product deployed at 200+ sites. Sporadic resets, roughly weekly. No pattern. Lab reproduction: impossible.
Black box revealed:
STATE_MQTT_RECONNECTRoot cause: MQTT reconnect logic allocated a 2 KB TLS buffer on each attempt but only freed it on success. After ~23 failed reconnects (exponential backoff), the heap was exhausted. The error handling logic failed to check for a NULL return from malloc, which led to a HardFault upon dereferencing. The default HardFault handler was trapped in an infinite loop, starving the watchdog task and leading to a watchdog reset.
Fix: Pre-allocate TLS buffer at init; reuse on reconnect. Added NULL pointer checks to all malloc calls and a heap watermark alert at 20% threshold.
Time to root-cause with black box: 4 hours. Estimated time without: 3-4 weeks of guesswork.
+------------------------------------------------------------------+| FIELD DIAGNOSTICS CHECKLIST |+------------------------------------------------------------------+| [ ] Reset reason captured before any peripheral init || [ ] HardFault handler saves registers + fault status to persist || [ ] Structured binary logging (not printf) with event codes || [ ] Circular log buffer in retained RAM + periodic flash flush || [ ] Runtime-configurable log levels per module || [ ] Watchdog warning interrupt captures pre-reset snapshot || [ ] Black box stores: uptime, version, state, events, watermarks || [ ] OTA-updatable debug build variant with extra instrumentation || [ ] Host-side decode tools (Python/CLI) with symbol mapping || [ ] VCD export for timeline visualization || [ ] All external reference URLs verified and accessible |+------------------------------------------------------------------+
Field debugging is not a tooling problem — it’s an architecture decision. The firmware must cooperate with diagnostics from day one:
The team that ships with a black box spends hours debugging field issues. The team that doesn’t spends weeks — or ships the same bug in the next release.
Quick Links
Legal Stuff