


Embedded Firmware Code Coverage Analysis on Target Hardware
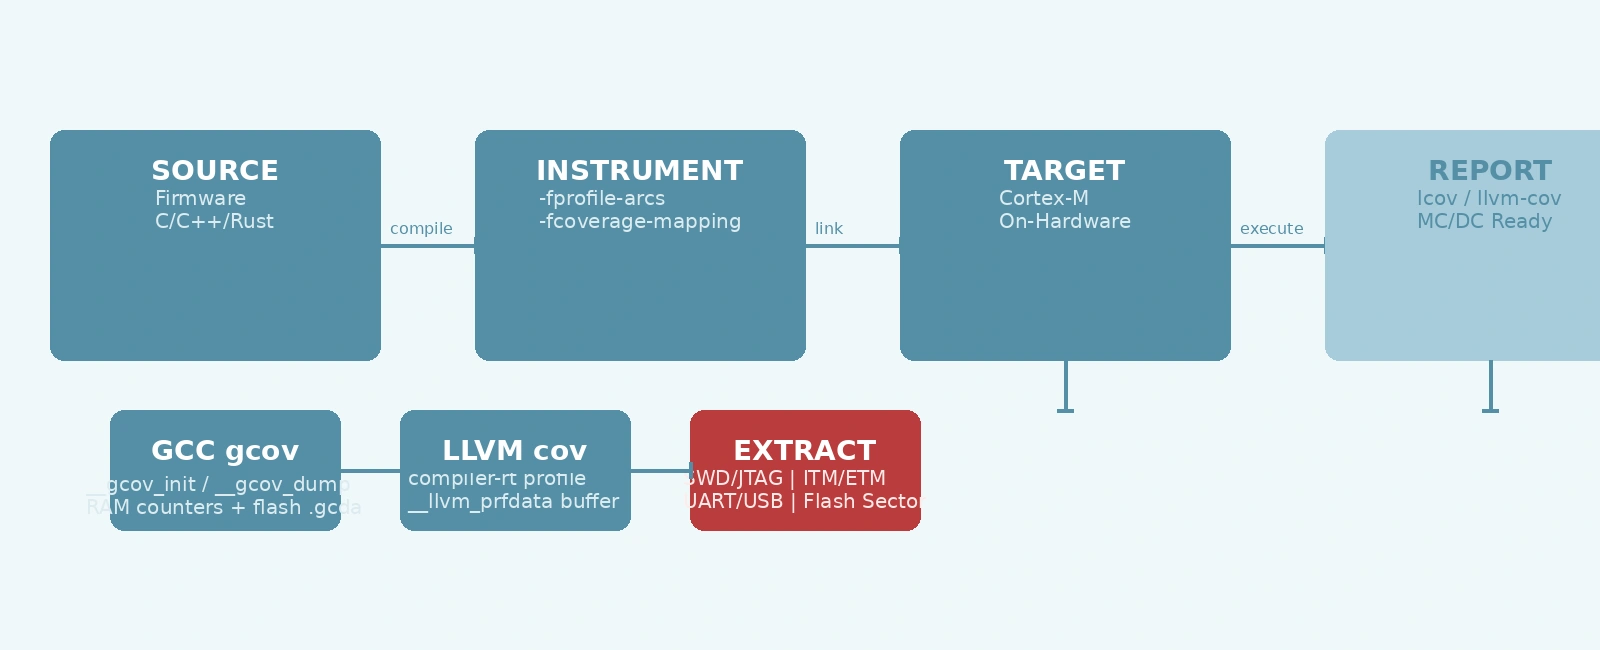
Table Of Contents
01
The Host vs. Target Coverage Gap
02
GCC gcov on Cortex-M: Runtime Porting
03
LLVM Coverage Mapping: compiler-rt Profile Runtime
04
Data Extraction Methods
05
Coverage Analysis Workflow
06
Practical Considerations
07
Safety-Critical Requirements: MC/DC
08
Summary
09
Related Reading
10
References
11
Frequently Asked Questions
Code coverage on embedded targets has historically been an afterthought — something you run on the host with mocked peripherals, then hope the results transfer to hardware. That approach misses entire classes of defects: interrupt nesting bugs, DMA completion paths, watchdog interactions, and cache coherency issues that only manifest on real silicon.
This article covers practical on-target coverage collection for ARM Cortex-M firmware using GCC gcov and LLVM compiler-rt, including the linker script modifications, runtime porting, and data extraction techniques that make it work in resource-constrained environments.
The Host vs. Target Coverage Gap
Host-based coverage (running firmware unit tests on x86_64 with mocked HAL) catches logic errors in algorithms and state machines. It does not catch:
- Interrupt handler execution paths — ISRs never run on host
- Peripheral register sequences — mock HALs simplify write ordering
- Memory map dependencies — linker sections, alignment, overlay regions
- Toolchain differences — host GCC vs. arm-none-eabi-gcc optimization behavior
- Timing-dependent paths — race conditions, timeout handlers, watchdog resets
Without on-target coverage validation, a substantial portion of target-specific code—specifically fault handlers, hardware startup code, and low-level peripheral drivers—remains unverified under real target hardware constraints.
GCC gcov on Cortex-M: Runtime Porting
GCC’s gcov instrumentation inserts counter increments at basic block entry points and generates static constructors for each translation unit (object file) compiled with -fprofile-arcs -ftest-coverage.
During startup, static constructors (located in .init_array or .ctors) are executed, passing a pointer to each translation unit’s struct gcov_info structure to __gcov_init(). On bare metal without standard OS file I/O, you provide a minimal implementation of __gcov_init() to maintain a linked list of registered coverage objects in RAM.
Linker Script Modifications
Your bare-metal startup code must invoke static constructors (.init_array) before entering main() so that __gcov_init() registers all translation units. Ensure .init_array and read-write data sections are correctly mapped:
SECTIONS{.text :{*(.text*)*(.rodata*)} > FLASH.init_array :{. = ALIGN(4);__init_array_start = .;KEEP(*(SORT(.init_array.*)))KEEP(*(.init_array*))__init_array_end = .;} > FLASH.data :{. = ALIGN(4);_sdata = .;*(.data*). = ALIGN(4);_edata = .;} > RAM AT > FLASH.bss :{. = ALIGN(4);_sbss = .;*(.bss*)*(COMMON). = ALIGN(4);_ebss = .;} > RAM}
Minimal gcov Runtime Implementation
// gcov_port.c — bare-metal registration for GCC gcov#include <stdint.h>#include <stddef.h>struct gcov_info {unsigned int version;struct gcov_info *next;unsigned int stamp;const char *filename;// Version-dependent fields follow in GCC libgcov};static struct gcov_info *gcov_list = NULL;// Called automatically by static constructors for each translation unitvoid __gcov_init(struct gcov_info *info) {if (info) {info->next = gcov_list;gcov_list = info;}}// Custom dump routine called on demand (e.g. via UART or GDB call)void __gcov_dump(void) {// Traverses gcov_list and streams pointer data/counters over hardware busstruct gcov_info *curr = gcov_list;while (curr) {// Process or transmit curr->filename and counter bufferscurr = curr->next;}}void __gcov_exit(void) {__gcov_dump();}
Compile firmware files with -fprofile-arcs -ftest-coverage and link gcov_port.o. Ensure __libc_init_array() or your custom loop executes constructors from __init_array_start to __init_array_end prior to main().
LLVM Coverage Mapping: compiler-rt Profile Runtime
LLVM uses source-based coverage (-fprofile-instr-generate -fcoverage-mapping). Coverage mapping metadata is embedded in read-only binary sections (__llvm_covmap and __llvm_covfun), while runtime execution counters and profile descriptors reside in dedicated RAM sections (__llvm_prf_cnts, __llvm_prf_data, __llvm_prf_names). An additional section __llvm_prf_vnds (value profiling nodes) may also be emitted if value profiling is enabled.
Linker Script for LLVM
LLVM’s profile runtime looks for explicit start and stop symbols for each section. Declare these symbols in your linker script and mark sections with KEEP to prevent linker garbage collection (--gc-sections):
SECTIONS{.llvm_covmap : ALIGN(4){KEEP(*(__llvm_covmap))KEEP(*(__llvm_covfun))} > FLASH.data : ALIGN(4){_sdata = .;*(.data*). = ALIGN(8);__start___llvm_prf_cnts = .;KEEP(*(__llvm_prf_cnts))__stop___llvm_prf_cnts = .;. = ALIGN(8);__start___llvm_prf_data = .;KEEP(*(__llvm_prf_data))__stop___llvm_prf_data = .;. = ALIGN(8);__start___llvm_prf_names = .;KEEP(*(__llvm_prf_names))__stop___llvm_prf_names = .;_edata = .;} > RAM AT > FLASH}
Compiler-rt Profile Runtime Integration
On bare-metal targets without a filesystem, use the buffer serialization APIs provided by LLVM’s <profile/InstrProfiling.h>:
// llvm_profile_port.c#include <stdint.h>#include <stddef.h>// Declarations from compiler-rt profile runtimeextern uint64_t __llvm_profile_get_size_for_buffer(void);extern int __llvm_profile_write_buffer(char *Buffer);extern void __llvm_profile_reset_counters(void);// Export flag required by compiler-rt to avoid OS stdio runtime hooksint __llvm_profile_runtime = 0;// Pre-allocated profile dump buffer in RAM#define COVERAGE_BUFFER_SIZE 4096char coverage_buffer[COVERAGE_BUFFER_SIZE];// Dump raw profile buffer into memory location or stream bufferint coverage_dump_buffer(char *buffer_out, size_t buffer_size) {uint64_t req_size = __llvm_profile_get_size_for_buffer();if (buffer_size < req_size) {return -1; // Buffer too small}return __llvm_profile_write_buffer(buffer_out);}void coverage_reset(void) {__llvm_profile_reset_counters();}
Build with -fprofile-instr-generate -fcoverage-mapping and link the bare-metal profile runtime library (libclang_rt.profile-arm.a or equivalent).
Data Extraction Methods
| Method | Pros | Cons | Best For |
|---|---|---|---|
| Debug probe (SWD/JTAG) memory read | Non-intrusive, no firmware changes | Requires probe, slow for large buffers | Development, CI with probe farm |
| ITM/ETM trace streaming | Zero overhead, real-time | Cortex-M3/M4/M7 only, needs trace probe | High-frequency counters, timing analysis |
| Self-hosted UART/USB dump | Works on any target, no probe | Firmware size + RAM overhead, intrusive | Production, field data, probe-less CI |
| Flash sector commit | Persists across resets | Wear on flash, slow write | Crash coverage, power-loss scenarios |
Debug Probe Extraction Script (OpenOCD + GDB + LLVM)
For LLVM source-based coverage, OpenOCD and GDB halt the MCU after test execution, invoke __llvm_profile_write_buffer() on the target to serialize a valid .profraw binary stream (with magic header and counter offsets), and dump the buffer to the host:
#!/bin/bash# extract_llvm_cov.sh — serialize and dump LLVM raw profile buffer via GDBELF=$1OUT_DIR=$2openocd -f interface/stlink.cfg -f target/stm32f4x.cfg &OCD_PID=$!sleep 2cat > /tmp/dump_cov.gdb <<EOFtarget remote localhost:3333monitor reset halt# Invoke target buffer serialization into preallocated RAM buffercall (int)__llvm_profile_write_buffer(coverage_buffer)# Determine the exact byte length writtenset \$len = (unsigned long)__llvm_profile_get_size_for_buffer()# Dump valid .profraw binary image directly to host filesystemdump binary memory $OUT_DIR/coverage.profraw coverage_buffer (coverage_buffer + \$len)monitor reset runquitEOFarm-none-eabi-gdb -x /tmp/dump_cov.gdb $ELFkill $OCD_PID# Convert raw profile to indexed profile data formatllvm-profdata merge -sparse $OUT_DIR/coverage.profraw -o $OUT_DIR/coverage.profdata# Generate HTML coverage reportllvm-cov show $ELF -instr-profile=$OUT_DIR/coverage.profdata -format=html -output-dir=$OUT_DIR/report
Self-Hosted UART Dump (Minimal)
When dumping profile buffers over a serial transport, frame the payload with length header and CRC32 checksum:
// Dump raw LLVM profraw buffer over UARTvoid coverage_dump_uart(void) {uint32_t len = (uint32_t)__llvm_profile_get_size_for_buffer();if (len > sizeof(coverage_buffer)) {return;}// Populate formatted .profraw data into buffer__llvm_profile_write_buffer(coverage_buffer);// Transmit 4-byte big-endian length headeruint32_t len_be = __builtin_bswap32(len);uart_write((const uint8_t *)&len_be, 4);// Transmit raw profile payloaduart_write((const uint8_t *)coverage_buffer, len);// Transmit CRC32 checksumuint32_t crc = crc32(0, (const uint8_t *)coverage_buffer, len);uint32_t crc_be = __builtin_bswap32(crc);uart_write((const uint8_t *)&crc_be, 4);}
Coverage Analysis Workflow
+-------------------------------------------------------------------------+| ON-TARGET CODE COVERAGE PIPELINE |+-------------------------------------------------------------------------+| || 1. COMPILE & LINK || clang / arm-none-eabi-gcc (-fprofile-instr-generate) || | || v || 2. FLASH & DEPLOY || firmware.elf ---------------> Target Hardware (Cortex-M) || | || v || 3. EXECUTE TESTS || Automated Test Suites / Stimulus (Coverage Counters in RAM) || | || v || 4. DATA EXTRACTION || +--------------------------+--------------------------+ || | | | || v v v || [ Debug Probe ] [ UART/USB Stream ] [ Flash Sector ] || (SWD/JTAG read) (Serial payload + CRC) (Crash/reset log) || | | | || +--------------------------+--------------------------+ || | || v || 5. PROFILE MERGE || llvm-profdata merge -sparse *.profraw -o coverage.profdata || | || v || 6. ANALYSIS & REPORTING || llvm-cov show firmware.elf -instr-profile=coverage.profdata || | || v || [ HTML Reports ] <---> [ CI Gating ] <---> [ MC/DC ] || |+-------------------------------------------------------------------------+
Practical Considerations
Counter Size & Atomic Updates
In GCC, gcov_type counters are 64-bit integers by default. LLVM also uses 64-bit unsigned counters (uint64_t).
On 32-bit ARM Cortex-M cores (which lack single-instruction 64-bit atomic increment instructions), concurrent increments inside interrupt service routines (ISRs) or multi-threaded RTOS tasks can lead to race conditions or torn writes. If coverage collection spans multithreaded environments, disable interrupts briefly during counter updates or use compiler flags such as -fprofile-update=atomic (where libatomic primitives are available).
RAM Budget
Typical Cortex-M4 firmware with ~50,000 lines of code (50KLOC) contains approximately 3,000 to 5,000 basic blocks.
- Counter RAM: 5,000 basic blocks × 8 bytes = ~40 KB (RAM)
- Profile Metadata: ~10–15 KB (RAM)
- Runtime code footprint: ~2–4 KB Flash + small stack allocation
Mitigation: Use -fprofile-exclude-files (or target specific modules) to instrument only critical components rather than the entire codebase.
Incremental Collection
For CI pipelines executing test suites iteratively, merge raw profiles incrementally using llvm-profdata:
# Merge newly captured profraw data with existing profdata baselinellvm-profdata merge -sparse -output=merged.profdata test_run_02.profraw merged.profdatallvm-cov report firmware.elf -instr-profile=merged.profdata
Safety-Critical Requirements: MC/DC
For DO-178C Level A, MC/DC (Modified Condition/Decision Coverage) is a mandatory objective. ISO 26262-6 Table 9 designates MC/DC as highly recommended (++) for ASIL-D software unit testing — effectively required unless a documented rationale justifies an alternative approach. MC/DC requires showing that each condition within a decision independently affects the decision’s outcome.
// Decision: if (A && (B || C))// Required MC/DC test set:// A B C | Result (D)// 1 1 0 | 1 (True) <-- Base case// 1 0 1 | 1 (True) <-- Demonstrates C independently affects D (compare with 1 0 0)// 1 0 0 | 0 (False) <-- Demonstrates B independently affects D (compare with 1 1 0)// 0 1 0 | 0 (False) <-- Demonstrates A independently affects D (compare with 1 1 0)
Starting with LLVM 18, Clang natively supports hardware-friendly MC/DC instrumentation via -fcoverage-mcdc. The generated profile data can be analyzed directly with llvm-cov show -show-mcdc. GCC requires external safety qualification toolchains (such as VectorCAST or LDRA) for MC/DC reporting.
Summary
On-target code coverage closes the verification gap between host tests and hardware reality. The implementation cost is modest — ~40KB RAM for counter state, a linker script update, and a concise runtime port — but the payoff is verifying execution paths (fault handlers, ISRs, and register interactions) that exist only on real silicon. For safety-critical systems, LLVM’s source-based coverage with MC/DC support provides a modern, scriptable path to software verification evidence.
Related Reading
References
- GCC gcov Internals — https://gcc.gnu.org/onlinedocs/gcc/Gcov.html
- LLVM Coverage Mapping Format — https://llvm.org/docs/CoverageMappingFormat.html
- DO-178C / ED-12C: Software Considerations in Airborne Systems — RTCA, 2011
- ISO 26262-6:2018 Road Vehicles — Functional Safety, Part 6: Product Development at the Software Level
- Clang Source-based Code Coverage Documentation — https://clang.llvm.org/docs/SourceBasedCodeCoverage.html
Frequently Asked Questions
Why is host-based code coverage insufficient for embedded firmware?
Host-based coverage misses hardware-specific execution paths like interrupt handlers, DMA callbacks, and peripheral register interactions that only exist on target hardware. Compiler optimizations also differ between host and target toolchains.
What is the minimum hardware requirement for on-target coverage collection?
A debug probe (J-Link, ST-Link, or similar) with SWD/JTAG access and enough RAM/flash to store coverage counters. Cortex-M3/M4/M7 with ITM/ETM trace support enables non-intrusive collection; simpler targets use instrumentation-based approaches.
How does GCC gcov differ from LLVM's coverage mapping on embedded targets?
GCC gcov relies on static constructor callbacks (__gcov_init) to register coverage structures for each object file. LLVM compiler-rt emits custom sections (__llvm_prf_cnts, __llvm_prf_data, __llvm_prf_names) and uses buffer APIs like __llvm_profile_write_buffer() to stream raw profile data.
Can code coverage be collected in production without a debug probe?
Yes, using self-hosted dump mechanisms. The firmware stores counters in reserved RAM/flash sectors and dumps them via UART, USB, or network on demand. This requires ~20-40KB RAM for counters plus a dump routine, but works on any target with a communication interface.
What coverage metric matters most for safety-critical embedded firmware?
MC/DC (Modified Condition/Decision Coverage) is mandatory for DO-178C Level A and highly recommended (++) for ISO 26262 ASIL-D. It proves each condition independently affects a decision outcome. Statement and branch coverage alone are insufficient for highest safety integrity levels.
Related Posts
Embedded Firmware Testing Strategies for Safety-Critical Systems
July 25, 2026
3 min
Unit Testing Embedded Firmware: A Practical Guide
June 28, 2026
5 min
CI for Embedded Firmware — Automating Builds & Tests
June 24, 2026
3 min
Linker Garbage Collection for Faster STM32 Builds
September 16, 2026
5 min
Debugging Intermittent I2C Bus Hangs in Embedded Systems
September 15, 2026
4 min
Quick Links
Legal Stuff