


Unit Testing Embedded Firmware: A Practical Guide
June 28, 2026
5 min
Debugging embedded firmware is fundamentally different from application debugging on a host OS. There is no console, no process isolation, and often no operating system at all. The target runs bare metal or under an RTOS, interrupts fire asynchronously, and timing is everything. This article surveys the debugging toolbox available to embedded engineers — from the humble printf to full JTAG/SWD hardware debug — and explains when each technique shines.
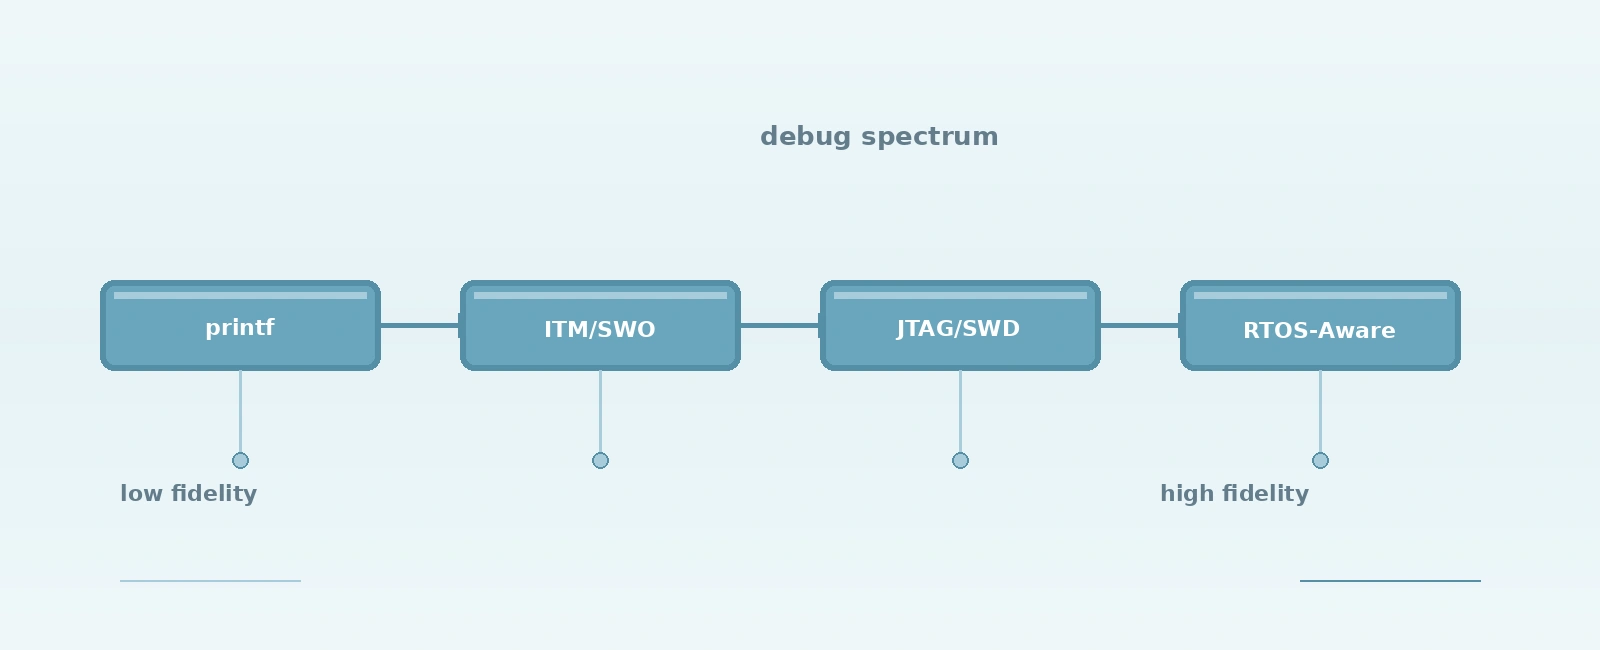
Embedded debugging techniques form a spectrum of intrusiveness and capability:
+------------------------------------------------------------------+| DEBUGGING TECHNIQUE SPECTRUM |+------------------------------------------------------------------+| LOW CAPABILITY HIGH CAPABILITY || || printf / UART ITM/SWO Trace JTAG / SWD Debug || (blocking I/O) (non-blocking) (hardware halt) || || +----------------+ +----------------+ +----------------+ || | Code change | | HW support | | Debug probe | || | required | | required | | required | || +----------------+ +----------------+ +----------------+ || | | | || v v v || Variable CPU Near-zero Full control || overhead overhead over target || |+------------------------------------------------------------------+
Each technique has its place. The skilled engineer chooses based on the problem at hand, not habit.
The oldest technique remains surprisingly effective for certain problems. Adding printf statements (or a lightweight logging macro) over UART gives visibility into code flow, variable values, and execution paths.
#define LOG_DEBUG(fmt, ...) printf("[DBG %s:%d] " fmt "\n", __func__, __LINE__, ##__VA_ARGS__)#define LOG_INFO(fmt, ...) printf("[INF %s:%d] " fmt "\n", __func__, __LINE__, ##__VA_ARGS__)#define LOG_ERROR(fmt, ...) printf("[ERR %s:%d] " fmt "\n", __func__, __LINE__, ##__VA_ARGS__)
Strengths:
Weaknesses:
printf halts the CPU until the UART transmitter drains. At 115200 baud, printing 80 characters takes ~7 ms — an eternity in a 1 kHz control loop.Best for: Boot sequence verification, configuration validation, low-frequency state reporting, and targets without debug probe access.
ARM Cortex-M cores include the Instrumentation Trace Macrocell (ITM) and optional Serial Wire Output (SWO). ITM provides 32 stimulus ports that software can write to; SWO streams this data out on a single pin at high speed (typically 1-4 MHz).
// ITM stimulus port 0 registers#define ITM_PORT0_U32 (*(volatile uint32_t*)0xE0000000UL)#define ITM_PORT0_U8 (*(volatile uint8_t*)0xE0000000UL)void itm_print(const char *str) {while (*str) {// Wait until FIFO is ready (blocks only if FIFO is full)while (ITM_PORT0_U32 == 0) {__asm volatile ("nop");}// Write 8-bit packet to save trace bandwidthITM_PORT0_U8 = *str++;}}
Strengths:
Weaknesses:
Best for: Real-time event tracing, performance profiling, interrupt latency analysis, RTOS task switching visualization.
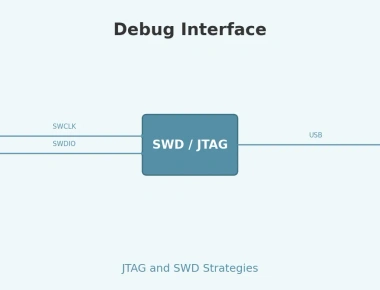
JTAG (Joint Test Action Group, IEEE 1149.1) and SWD (Serial Wire Debug) provide the gold standard: full control over the target CPU via a debug probe.
| Probe | JTAG | SWD | SWO | Price Tier |
|---|---|---|---|---|
| Segger J-Link | Yes | Yes | Yes | Premium |
| ST-Link V2/V3 | Yes | Yes | Yes | Low |
| CMSIS-DAP (generic) | Yes | Yes | Sometimes | Low |
| FTDI-based (FT2232/FT4232) | Yes | Yes | Via UART RX | Mid |
OpenOCD (Open On-Chip Debugger) is the bridge between GDB and the debug probe:
# Terminal 1: Start OpenOCD serveropenocd -f interface/stlink.cfg -f target/stm32f4x.cfg# Terminal 2: Connect GDBarm-none-eabi-gdb build/firmware.elf(gdb) target extended-remote localhost:3333(gdb) monitor reset halt(gdb) load(gdb) monitor reset halt(gdb) break main(gdb) continue
Common GDB Commands for Embedded:
break function_name # Set breakpointbreak *0x08001234 # Break at addresswatch *(uint32_t*)0x20000000 # Watch memory locationinfo registers # Show CPU registersbt # Backtraceframe 3 # Switch stack frameprint /x my_var # Print in hexset var my_var = 0xDEADBEEF # Modify memory/registermonitor reset # Reset target via OpenOCD
Strengths:
Weaknesses:
load commands erase/program flash sectorsBest for: Logic bugs, crash analysis, memory corruption, register-level peripheral debugging, bootloader bring-up.
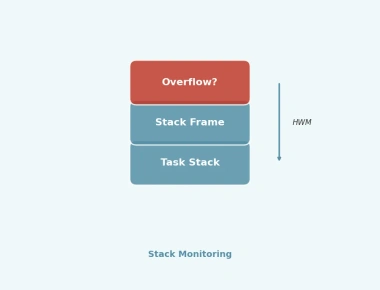
When running FreeRTOS, Zephyr, or ThreadX, standard GDB sees only the currently running task. RTOS-aware debugging adds task list, stack usage, queue/semaphore state, and task-specific backtraces.
OpenOCD RTOS support:
# In your OpenOCD target configuration script:$_TARGETNAME configure -rtos FreeRTOS# Then in GDB:info threads # List FreeRTOS tasksthread 3 # Switch to task 3 contextbt # Backtrace for that task
IDE Integration: VS Code with Cortex-Debug, Eclipse, IAR, Keil, and CLion all support RTOS-aware views showing task state (Ready/Running/Blocked/Suspended), stack watermarks, and kernel object status.
When a HardFault, MemManage, BusFault, or UsageFault occurs, the CPU saves context to the stack. A fault handler can capture this for later analysis.
// Minimal HardFault handler capturing stacked registers__attribute__((naked)) void HardFault_Handler(void) {__asm volatile ("tst lr, #4\n""ite eq\n""mrseq r0, msp\n""mrsne r0, psp\n""b hard_fault_handler_c\n");}void hard_fault_handler_c(uint32_t *stacked) {// stacked[0]=R0, [1]=R1, [2]=R2, [3]=R3, [4]=R12, [5]=LR, [6]=PC, [7]=xPSRvolatile uint32_t pc = stacked[6];volatile uint32_t lr = stacked[5];// Log to backup RAM, flash, or transmit via ITM(void)pc; (void)lr; // Retain in memory for debugger inspectionwhile (1); // Halt for probe attachment}
Cortex-M Fault Status Registers:
With these registers and the stacked PC/LR, you can often pinpoint the exact instruction that caused the fault without a probe attached at crash time.
openocd -f interface/stlink.cfg -f target/stm32f4x.cfg should connect without errors and report hardware breakpointsflash probe 0, flash info 0, flash write_image erase build/firmware.elfmonitor reset halt should stop at reset vectormain, continue, verify stop| Technique | Intrusiveness | Hardware Needed | Best For |
|---|---|---|---|
printf/UART | High (blocking) | UART only | Boot logs, config checks |
| ITM/SWO Trace | Near-zero | Cortex-M + SWO pin + probe | Real-time tracing, profiling |
| JTAG/SWD + GDB | High (halts CPU) | Debug probe + header | Logic bugs, crashes, register inspection |
| RTOS-aware | High (halts CPU) | Probe + RTOS plugin | Task deadlocks, stack overflows, queue states |
| Post-mortem | None (after crash) | Backup RAM / flash | Field failures without probe |
The most effective debugging strategy combines techniques: use ITM/SWO for continuous field telemetry, printf for quick sanity checks during development, and JTAG/SWD for deep investigation when things go wrong. Master the toolchain — OpenOCD, GDB, and your probe’s capabilities — and you’ll spend less time guessing and more time fixing.
Quick Links
Legal Stuff